Over time I have worked a lot with continuous delivery and tried to explain why it is such an important concept. When I was asked for a reading list, I was left without a clear answer. So this is an attempt at creating one. 📚
I have some writing that I might do around these concepts, but this list is it for now. Check back later, I will update this when I have something. 😊 Let me know if you have any feedback or questions.
📗 Automated testing is essential, and I would argue you get a lot further with TDD. Regardless of whether you do test first or after, you can learn a lot from Kent Becks’ Test Driven Development: By Example.
📝 When you deliver multiple times a day you can’t have bugs occurring all the time. In Bugs Optional? Kent Beck describes the effect continuous delivery can have on bugs. It also describes how building a culture for delivering requires few bugs.
📝 Real Options: Making small changes to production all the time supercharges your learning process. I have always appreciated how it pushes us to keep options open for later. Chris Matts and Olav Maassen has written about real options.
📝 I think Observability is usually the least explored part of Continuous Delivery but also essential when speed increases. If you want to explore you can read about 📝 the three pillars of observability and how you should focus on results by moving 📝 Beyond the 3 Pillars of Observability.
If you would like to dig even deeper into observability have a look at 📗 read Honeycombs’ Observability book. Thanks to Erlend Wiig for pointing it out to me.
And I really like the defaults in 🌐 New Relic APM (with an agent). I recommend testing that to see how easy it can be to get deep insights into your application.
Some general resources that I generally appreciate for this:
📝 Kent Beck has always been a great inspiration and he writes a lot on Substack. Well worth the read even though it is less about continuous delivery explicitly.
🌐 eXtreme Programming is considered by many to the be essence of agile and continuous delivery.
There’s of course a lot of related topics that I take for granted. Things like DevOps, Infrastructure as Code, Build Pipelines and Continuous Integration are essential but not mentioned. You can easily find a lot about them online.
Let me know if I should include anything else. I would love to learn something new as well. 🙂
Thanks to Terje Heen and Asgaut Mjølne for contributing with input and content. Also a bit of AI. 😊 Gemini and Claude are my favourites.
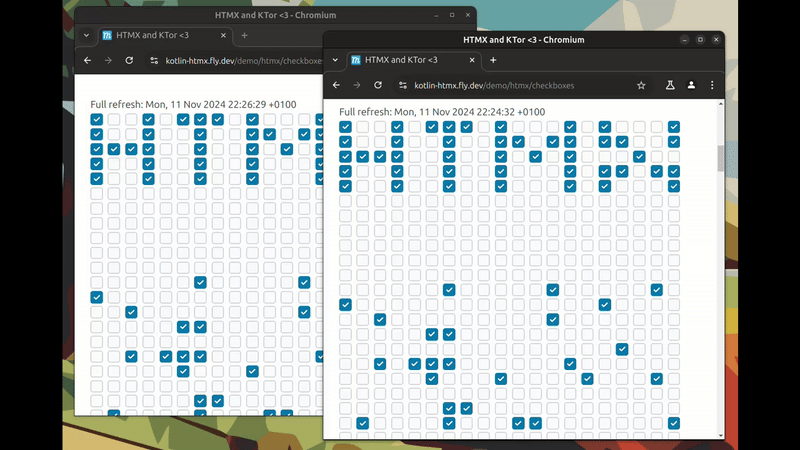
TL;DR: Synchronised state between multiple browser windows. With plain HTML + HTMX (SSE in the background). And no JavaScript or page reloading!
UPDATE (July 25): The awesome people at KTor has released HTMX support. You do this just fine without, but this makes it easier to understand. Go here to have a look: https://ktor.io/docs/htmx-integration.html
This is a video of synchronised instant updates across browser windows. Every time a checkbox is clicked, and updated to the server; an event is sent to the other browser window(s) and they update.
This approach leverages server-sent events for real-time updates while keeping the front-end simple and declarative. While it may seem counter intuitive to those used to client-side state management, it offers a compelling alternative for many interactive web applications.
Read on to find out how you can implement this yourself. The front end part is simply HTML + HTMX and relevant for many, but the back end part is Kotlin specific. Concepts should be easily transferable to your favourite back end and language though.
If you are anxious to see the code you can find the Github repository here. Direct links to parts of the code is scattered throughout the article.
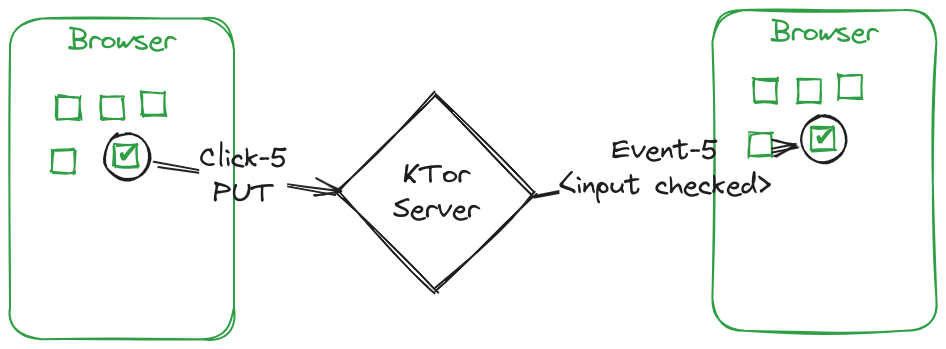
Event flow and overview
To make this page with automatic updates you have to:
Generate HTML on the back end (use your favourite). It’s just a lot of check boxes. (I use KTor Server + Kotlin HTML DSL)
Tell HTMX to send a PUT to the server when a check box is clicked (hx-put).
Tell HTMX to listen for SSE events (sent from the server when state changes) (sse-connect).
Tell HTMX to swap out the HTML element (the check box) when an event arrives with new HTML as the payload (sse-swap).
Below is the flow with a KTor server in between. Notice how the number of the checkbox (PUT request) enables us to send an event that tells us exactly which box needs updating.
SSE (Server Sent Events) is a Browser standard that handles the details of sending messages from a server to a browser. It can be used in all major browsers and defines the format and connection semantics. If you want to know more there’s a short chapter towards the end of this blog post with details.
While HTMX + HTML may require a mental shift from modern JavaScript frameworks, it offers a simpler and cleaner model for many front end needs. And it makes it easier to work properly full stack. See the section at the end for a quick comparison with React.
Even if you don’t like HTMX, consider using some of the lighter JS alternatives (and generate HTML on the back end) to enable full stack development and efficiency.
This demo is inspired by Hamilton Greens’ 1000 checkboxes. His solution uses polling, so I started wondering if it could be done completely event driven. When KTor 3.0 recently came out with SSE support, I had to try. And it worked out great! With no JavaScript, some HTML and some HTMX directives. 😄
Alright, let’s get into the details.
The front end (HTMX)
The front end I’m describing here consists solely of HTML with a lot of check boxes. Here’s our starting HTML:
This DIV contains a set of check boxes. That’s it. Generate it thousands of times, and you’ll have a grid of check boxes like in the video at the start of this article. You can add IDs to it if you want (the box number), but it is not required for this to work.
Then we add HTMX, it is simply a matter of including the right <script> tags. You can read about it here.
The (common) state on the back end in my prototype is just a MutableList<Boolean> in memory. But in real life you would probably want to store it in a database or similar.
Then we add a PUT operation to each checkbox to update the server when clicked:
HTMX (the script) scans the HTML on load and finds hx-* directives. It then adds listeners that performs an action. This is a declarative way to add behaviour to our page. The default trigger for this is “on click”, but you can use hx-trigger to change that (like ‘delay 10s’ or something).
When the element is clicked it will issue a PUT request to the URL, and take the response and replace itself (outerHTML, innerHTML is inside and is the default if not specified). A request is issued, the resulting response is shown. However, this only updates the current window’s state. We want this to be updated in all windows…
When the PUT is received on the server side, we toggle the state of the checkbox and save it to the “database” (the MutableList<Boolean>). Then we publish an event on the SSE endpoint to all the listeners.
Because it is possible to get a race condition between the PUT and an incoming event I add an “invisible” SPAN around each check box that also becomes the container for the HX-* attributes:
The event and new state is picked up by all the browser windows because we have added a SSE listen endpoint (sse-connect with a URL) on the parent element. This makes the browser connect to the endpoint and listen for events.
These HTMX tags work together like this:
hx-ext="sse" and sse-connect – The first DIV subscribes to the checkboxes/events endpoint and activates the HTMX SSE extension.
sse-swap="update-43" – Each input is wrapped in a SPAN that subscribes to a specific event called “update-” plus the number of the checkbox.
The contents of the SPAN will be replaced when an event matching it is received, and with the HTML received in the data of the event.
The effect of this is that only one element is swapped out when an event occurs (the name of the event is per checkbox). You could also update the whole checkbox matrix, but I wanted to see if I could make it work in tiny updates. If the number is high, it would be slow too.
There is actually a event that will reload the whole matrix called “update-all” that is used to refresh on a re-connect. You can see the code for that here.
That’s all! By using just hx-ext, hx-put, sse-swap and sse-connect attributes, we dramatically reduce front end code while maintaining a simple, declarative approach. I love it. 😁🚀
While debugging library issues like misnamed events can be challenging initially, the benefits outweigh the learning curve. Experience will make troubleshooting easier over time.
A change in mindset?
One important difference to note if you’re coming from a JavaScript framework like React is that there is no separate front-end state management (no useState, Redux, or similar).
Instead, your HTML structure itself is the state – what you see is what you get.
Each checkbox’s checked attribute directly reflects its current state, and every state change triggers a server request that may update the HTML. Either through a response, or in our case an event.
Combined with URL parameters for navigation state, this simpler model can handle many situations that traditionally required complex client-side state management.
For example, instead of:
const [isChecked, setIsChecked] = useState(false);// …plus event handlers, effects, etc.
State with React – JavaScript
You simply have (note, not the wrapping SPAN here):
You can use any back end you like, but KTor does support SSE out of the box so I decided to use that. And I like the Kotlin HTML DSL.
I won’t go into lots of details here as most of the Kotlin code has been covered before. To enable SSE in Kotlin you have to install the correct dependencies and then activate the SSE Plugin:
install(SSE)
Installing the SSE plugin in KTor – Kotlin
Then you can define an SSE endpoint together with the other routes like this:
sse("events") {// Reconnect detectionif (this.call.request.headers["Last-Event-ID"] != null) {// Send update all if just reconnectedthis.send(data = "true", event = "update-all", id = UUID.randomUUID().toString() ) logger.info("SSE Reconnect detected, sending update-all") } else { logger.info("SSE First connection") }// Register connection so we can notify on change htmxCheckboxDemoPage.registerNotification(this)// Ping and detect dead connectionsvar alive = truewhile (alive) {try {// Send ping every 10 secondsthis.send("ping", "connection", UUID.randomUUID().toString())delay(10.seconds) } catch (e: IOException) {// Could not send, so assume disconnected alive = false htmxCheckboxDemoPage.unregister(this) logger.debug("Detected dead connection, unregistering", e) } }}
SSE Endpoint for publishing events in KTor – Kotlin
The code above does:
ServerSSESession (registerNotification(this)) is sent to the page that contains the state (in memory for the prototype), so it can send a message when it changes.
A never ending loop that keeps the connection open and pings every once in a while. Removes dead connections. I was not sure this was needed, but seems to stop working properly when I skip it.
When a reconnect is detected (Last-Event-ID header) a update all event is issued. This has some caveats, but you can read about it in the SSE section below.
There is also a bit of tweaking and bending around Kotlin HTML DSL to be able to render just the INPUTHTML in Kotlin there the state ((partialHtml(...) plus checkbox(...)), but it all worked out in the end. Take a look at the full code if you are interested.
In the page, when something changes we send events to all the listeners:
// In the page object with a list of listenersval iterator = connectedListeners.iterator()while (iterator.hasNext()) {try {// Send to each listener iterator.next().send(partialHtml {renderCheckbox(boxNumber, checkboxState[boxNumber]) },"update-$boxNumber", UUID.randomUUID().toString() ) } catch (e: IOException) {// Error, assume disconnected and remove logger.info("Dead connection detected, unregistering", e) iterator.remove() }}
Page code to notify listeners – Kotlin
The list of listeners is instances of ServerSSESession, so we iterate through them and send the event.
That’s it really for the back end. Easy as that. 😉 SSE handling can be a bit new, but an awesome part of the standards. And it’s all just HTML.
Summary
Less code, with a pretty minimal additional complexity. It stays close to basic HTML and has a life cycle that is easy to understand. And you don’t have a million frameworks or libraries to update versions of in six months. With no front end build.
It requires a change in mindset compared to modern front-end stacks, but I believe it’s better for many cases. Try it out and share any comments or issues.
Caveats
When scaling the back end (multiple processes), you need to store the common state. This is usually a DB, but your mileage may vary.
Like I already mentioned; this example doesn’t handle replays after lost connections.
HTMX scans the whole page for elements, and registers listeners for each. So it becomes unbearably slow with millions of check boxes. If you need that amount of check boxes, don’t choose HTMX. 🙂
Server Sent Events
Server Sent Events is as I previously mentioned a Browser standard. HTMX simply provides a wrapper around the JavaScript API, and lets us in a declarative way describe which elements should respond to which event.
Some important things to understand about SSE:
The API is unidirectional and only the server can send messages. Websockets is a better choice for bi-directional communication. Here’s HTMX support for it.
When it connects, it is the browser that manages the connection and reconnects automatically if necessary. When it does: it will send a Last-Event-ID header. IF at least one of the messages contains an ID, it doesn’t have to be sequential either. You can send events both with and without IDs, but it will always send the last ID it received.
It maintains a persistent connection, which is why we implement a ping loop on the server side to keep it alive.
The event Last-Event-ID header enables us to do replays of messages while disconnected. But in this example we don’t do that. Instead we send a update-all event which triggers a full reload of the matrix.
Full reloads on reconnect (like I implemented) don’t preserve offline changes (checkbox toggles made while disconnected). Implementing event replay would solve this, though it requires maintaining message state and sequencing on the server.
Generating HTML?
I have skipped some steps when it comes to the back end. It should be possible to find information online about generating HTML in your preferred one. Then add your HTMX tags.
Here is one approach to achieving this using Express.js. You also need to handle PUT and SSE in your preferred server. 🙂
Read on for a solution to loading environment variables from a .env file. The code is for Kotlin, but should be easy to replicate in other stacks as well. No frameworks, low complexity. 🙂
I try to not add frameworks or libraries unless they add great value. Of course I don’t want to re-invent the wheel, but there is always more complexity and limitations to the libraries than you first think. And then it is a chore to replace it.
Start small and expand. 🙂
A lot of things are really not that complex to write code for. Application configs are one of those things. Even working across Gradle and local development in your IDE.
Get a variable from a file, if it exists in the ENV; use that instead. It’s that simple. 🙂 Need something a bit fancier? Just extend the code, you can do it. 😉
So here’s the Kotlin code for a config with the code to load it. Just one key here, but you get the gist of it:
The config is loaded in tests and in the KTor setup by calling the load function like this:
funApplication.module() {configureHTTP()configureMonitoring()configureSerialization()configureRouting()// Manual dependency injection :) Usually smart to find a separate place to do this from KTorval config = ApplicationConfig.load()val mainPage =MainPage(LookupClient(config.lookupApiKey))val selectedPage =SelectedPage()// Load pagesconfigurePageRoutes(mainPage, selectedPage)}
Kotlin
As a bonus, you also see manual dependency injection. It really works. 🙂 And it really helps keeping the compiler give real feedback when something changed that needs to be updated.